til: cloudrun_use-labels-for-billing-breakdown.md
This data as json
| path | topic | title | url | body | html | shot | created | created_utc | updated | updated_utc | shot_hash | slug |
|---|---|---|---|---|---|---|---|---|---|---|---|---|
| cloudrun_use-labels-for-billing-breakdown.md | cloudrun | Use labels on Cloud Run services for a billing breakdown | https://github.com/simonw/til/blob/main/cloudrun/use-labels-for-billing-breakdown.md | Thanks to [@glasnt](https://github.com/glasnt) for the tip on this one. If you want a per-service breakdown of pricing on your Google Cloud Run services within a project (each service is a different deployed application) the easiest way to do it is to apply labels to those services, then request a by-label pricing breakdown. This command will update a service (restarting it) with a new label: ```bash gcloud run services update csvconf --region=us-central1 --platform=managed --update-labels service=csvconf ``` I found it needed the `--platform=managed` and `--region=X` options to avoid it asking interactive questions. Here's a bash script which loops through all of the services that do NOT have a `service` label and applies one: ```bash #!/bin/bash for line in $( gcloud run services list --platform=managed \ --format="csv(SERVICE,REGION)" \ --filter "NOT metadata.labels.service:*" \ | tail -n +2) do IFS=$','; service_and_region=($line); unset IFS; service=${service_and_region[0]} region=${service_and_region[1]} echo "service: $service region: $region" gcloud run services update $service \ --region=$region --platform=managed \ --update-labels service=$service echo done ``` It runs the equivalent of this for each service: ``` gcloud run services update asgi-log-demo --region=us-central1 --platform=managed --update-labels service=asgi-log-demo ``` I saved that as a `runme.sh` script, run `chmod 755 runme.sh` and then `./runme.sh` to run it. The output of the script looked like this (one entry for each service) - each one took ~30s to run. ``` Service [covid-19] revision [covid-19-00122-zod] has been deployed and is serving 100 percent of traffic at https://covid-19-j7hipcg4aq-uc.a.run.app ✓ Deploying... Done. ✓ Creating Revision... ✓ Routing traffic... Done. ``` I had to wait a couple of days for this to take effect, but once it did I could get results by visiting Billing -> Reports, then selecting `service` from the group by menu here: <img src="https://raw.githubusercontent.com/simonw/til/main/cloudrun/use-labels-for-billing-breakdown-1.png" width="300"> The graph (I picked bar chart over line chart) looked like this: 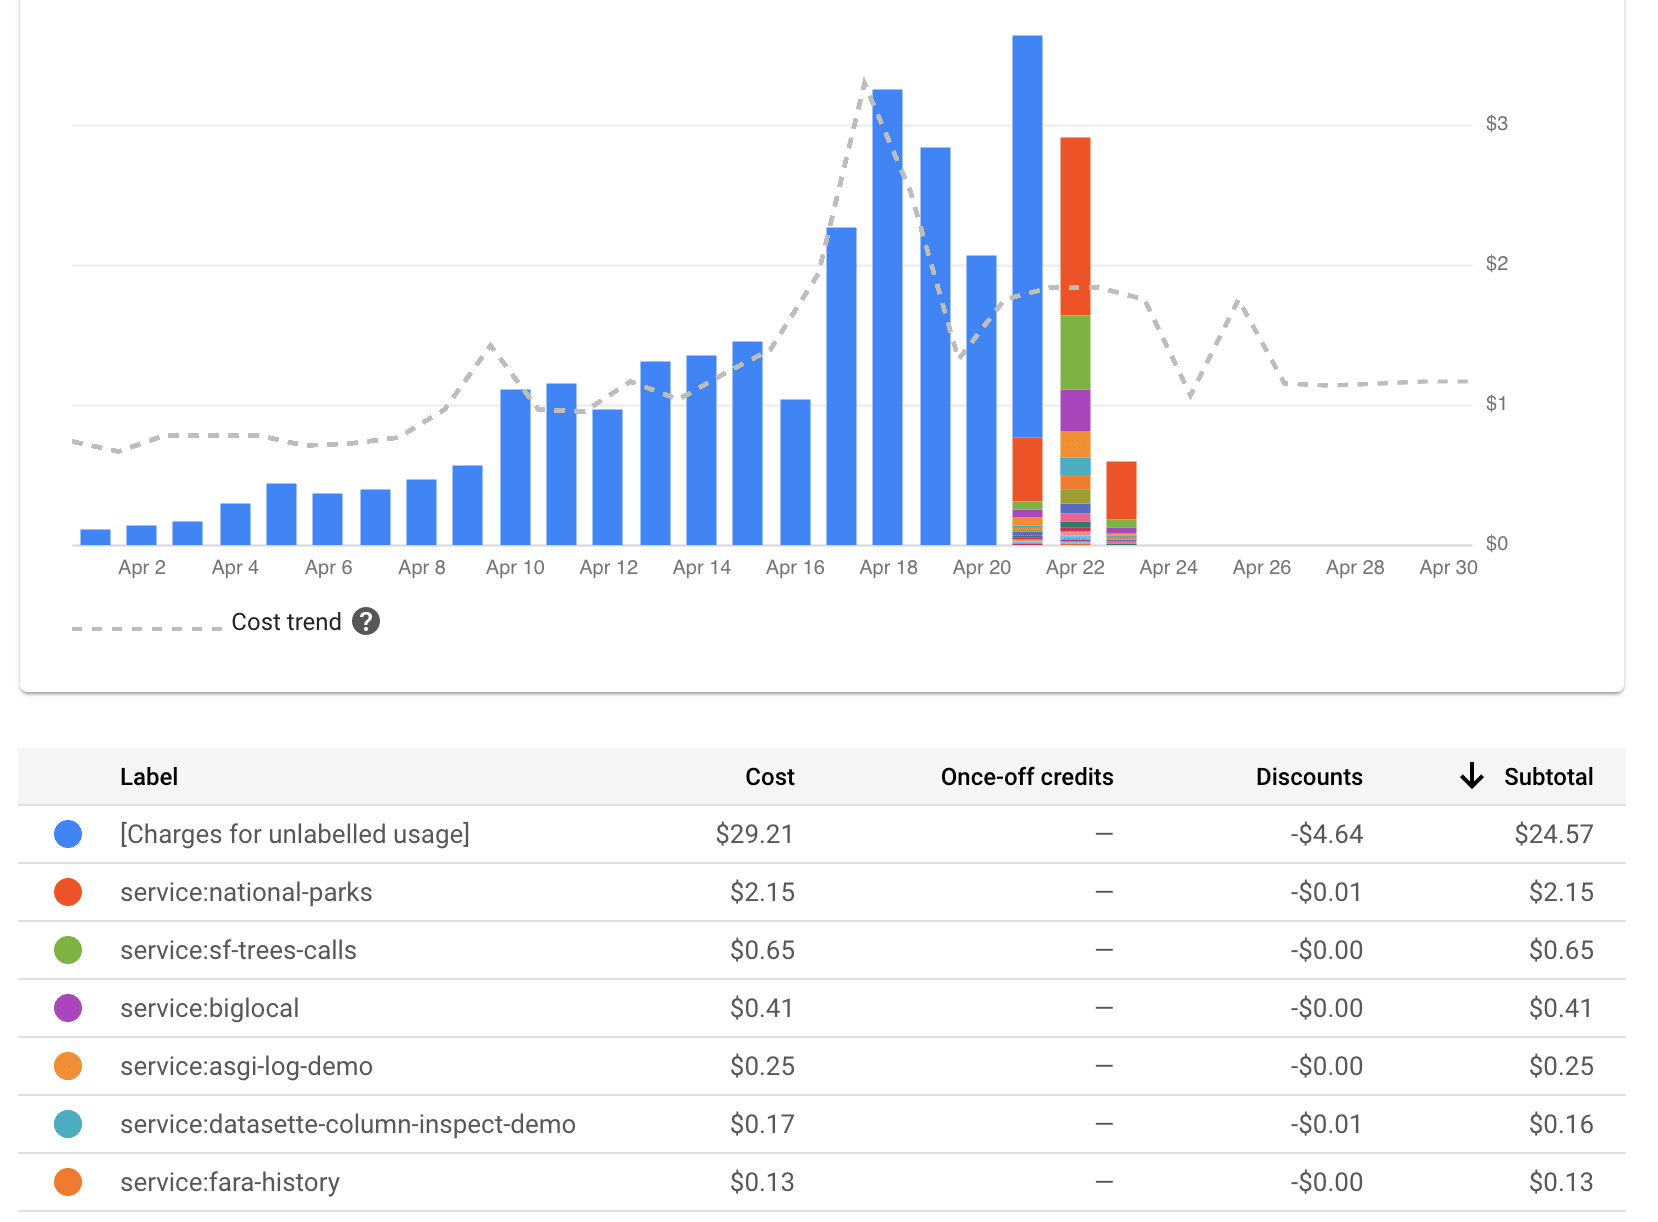 ## Using the metrics explorer Even without setting up these extra `service` labels the [Metrics explorer](https://console.cloud.google.com/monitoring/metrics-explorer) can show you breakdowns of billing time against different services. Here's how to configure that: <img src="https://raw.githubusercontent.com/simonw/til/main/cloudrun/billing-metrics-explorer.png" width="300"> [Bookmarked query](https://console.cloud.google.com/monitoring/metrics-explorer?project=datasette-222320&pageState=%7B%22xyChart%22:%7B%22dataSets%22:%5B%7B%22timeSeriesFilter%22:%7B%22filter%22:%22metric.type%3D%5C%22run.googleapis.com%2Fcontainer%2Fbillable_instance_time%5C%22%20resource.type%3D%5C%22cloud_run_revision%5C%22%22,%22minAlignmentPeriod%22:%2260s%22,%22aggregations%22:%5B%7B%22perSeriesAligner%22:%22ALIGN_RATE%22,%22crossSeriesReducer%22:%22REDUCE_NONE%22,%22alignmentPeriod%22:%2260s%22,%22groupByFields%22:%5B%5D%7D,%7B%22crossSeriesReducer%22:%22REDUCE_NONE%22,%22alignmentPeriod%22:%2260s%22,%22groupByFields%22:%5B%5D%7D%5D%7D,%22targetAxis%22:%22Y1%22,%22plotType%22:%22LINE%22%7D%5D,%22options%22:%7B%22mode%22:%22COLOR%22%7D,%22constantLines%22:%5B%5D,%22timeshiftDuration%22:%220s%22,%22y1Axis%22:%7B%22label%22:%22y1Axis%22,%22scale%22:%22LINEAR%22%7D%7D,%22isAutoRefresh%22:true,%22timeSelection%22:%7B%22timeRange%22:%221h%22%7D%7D) (only works for me) | <p>Thanks to <a href="https://github.com/glasnt">@glasnt</a> for the tip on this one. If you want a per-service breakdown of pricing on your Google Cloud Run services within a project (each service is a different deployed application) the easiest way to do it is to apply labels to those services, then request a by-label pricing breakdown.</p> <p>This command will update a service (restarting it) with a new label:</p> <div class="highlight highlight-source-shell"><pre>gcloud run services update csvconf --region=us-central1 --platform=managed --update-labels service=csvconf</pre></div> <p>I found it needed the <code>--platform=managed</code> and <code>--region=X</code> options to avoid it asking interactive questions.</p> <p>Here's a bash script which loops through all of the services that do NOT have a <code>service</code> label and applies one:</p> <div class="highlight highlight-source-shell"><pre><span class="pl-c"><span class="pl-c">#!</span>/bin/bash</span> <span class="pl-k">for</span> <span class="pl-smi">line</span> <span class="pl-k">in</span> <span class="pl-s"><span class="pl-pds">$(</span></span> <span class="pl-s"> gcloud run services list --platform=managed \</span> <span class="pl-s"> --format=<span class="pl-s"><span class="pl-pds">"</span>csv(SERVICE,REGION)<span class="pl-pds">"</span></span> \</span> <span class="pl-s"> --filter <span class="pl-s"><span class="pl-pds">"</span>NOT metadata.labels.service:*<span class="pl-pds">"</span></span> \</span> <span class="pl-s"> <span class="pl-k">|</span> tail -n +2<span class="pl-pds">)</span></span> <span class="pl-k">do</span> IFS=<span class="pl-s"><span class="pl-pds">$'</span>,<span class="pl-pds">'</span></span><span class="pl-k">;</span> service_and_region=(<span class="pl-smi">$line</span>)<span class="pl-k">;</span> <span class="pl-c1">unset</span> IFS<span class="pl-k">;</span> service=<span class="pl-smi">${service_and_region[0]}</span> region=<span class="pl-smi">${service_and_region[1]}</span> <span class="pl-c1">echo</span> <span class="pl-s"><span class="pl-pds">"</span>service: <span class="pl-smi">$service</span> region: <span class="pl-smi">$region</span><span class="pl-pds">"</span></span> gcloud run services update <span class="pl-smi">$service</span> \ --region=<span class="pl-smi">$region</span> --platform=managed \ --update-labels service=<span class="pl-smi">$service</span> <span class="pl-c1">echo</span> <span class="pl-k">done</span></pre></div> <p>It runs the equivalent of this for each service:</p> <pre><code>gcloud run services update asgi-log-demo --region=us-central1 --platform=managed --update-labels service=asgi-log-demo </code></pre> <p>I saved that as a <code>runme.sh</code> script, run <code>chmod 755 runme.sh</code> and then <code>./runme.sh</code> to run it.</p> <p>The output of the script looked like this (one entry for each service) - each one took ~30s to run.</p> <pre><code>Service [covid-19] revision [covid-19-00122-zod] has been deployed and is serving 100 percent of traffic at https://covid-19-j7hipcg4aq-uc.a.run.app ✓ Deploying... Done. ✓ Creating Revision... ✓ Routing traffic... Done. </code></pre> <p>I had to wait a couple of days for this to take effect, but once it did I could get results by visiting Billing -> Reports, then selecting <code>service</code> from the group by menu here:</p> <p><a href="https://raw.githubusercontent.com/simonw/til/main/cloudrun/use-labels-for-billing-breakdown-1.png" target="_blank" rel="nofollow"><img src="https://raw.githubusercontent.com/simonw/til/main/cloudrun/use-labels-for-billing-breakdown-1.png" width="300" style="max-width:100%;"></a></p> <p>The graph (I picked bar chart over line chart) looked like this:</p> <p><a href="https://raw.githubusercontent.com/simonw/til/main/cloudrun/use-labels-for-billing-breakdown-2.png" target="_blank" rel="nofollow"><img src="https://raw.githubusercontent.com/simonw/til/main/cloudrun/use-labels-for-billing-breakdown-2.png" alt="Graph" style="max-width:100%;"></a></p> <h2> <a id="user-content-using-the-metrics-explorer" class="anchor" href="#using-the-metrics-explorer" aria-hidden="true"><span aria-hidden="true" class="octicon octicon-link"></span></a>Using the metrics explorer</h2> <p>Even without setting up these extra <code>service</code> labels the <a href="https://console.cloud.google.com/monitoring/metrics-explorer" rel="nofollow">Metrics explorer</a> can show you breakdowns of billing time against different services.</p> <p>Here's how to configure that:</p> <p><a href="https://raw.githubusercontent.com/simonw/til/main/cloudrun/billing-metrics-explorer.png" target="_blank" rel="nofollow"><img src="https://raw.githubusercontent.com/simonw/til/main/cloudrun/billing-metrics-explorer.png" width="300" style="max-width:100%;"></a></p> <p><a href="https://console.cloud.google.com/monitoring/metrics-explorer?project=datasette-222320&pageState=%7B%22xyChart%22:%7B%22dataSets%22:%5B%7B%22timeSeriesFilter%22:%7B%22filter%22:%22metric.type%3D%5C%22run.googleapis.com%2Fcontainer%2Fbillable_instance_time%5C%22%20resource.type%3D%5C%22cloud_run_revision%5C%22%22,%22minAlignmentPeriod%22:%2260s%22,%22aggregations%22:%5B%7B%22perSeriesAligner%22:%22ALIGN_RATE%22,%22crossSeriesReducer%22:%22REDUCE_NONE%22,%22alignmentPeriod%22:%2260s%22,%22groupByFields%22:%5B%5D%7D,%7B%22crossSeriesReducer%22:%22REDUCE_NONE%22,%22alignmentPeriod%22:%2260s%22,%22groupByFields%22:%5B%5D%7D%5D%7D,%22targetAxis%22:%22Y1%22,%22plotType%22:%22LINE%22%7D%5D,%22options%22:%7B%22mode%22:%22COLOR%22%7D,%22constantLines%22:%5B%5D,%22timeshiftDuration%22:%220s%22,%22y1Axis%22:%7B%22label%22:%22y1Axis%22,%22scale%22:%22LINEAR%22%7D%7D,%22isAutoRefresh%22:true,%22timeSelection%22:%7B%22timeRange%22:%221h%22%7D%7D" rel="nofollow">Bookmarked query</a> (only works for me)</p> | <Binary: 74,162 bytes> | 2020-04-21T17:52:57-07:00 | 2020-04-22T00:52:57+00:00 | 2021-12-21T13:02:50-08:00 | 2021-12-21T21:02:50+00:00 | 9157d6cd2112e335ce93afbece19a833 | use-labels-for-billing-breakdown |