

![]()
![]()
Render a map for any query with a geometry column
Install this plugin in the same environment as Datasette.
$ datasette install datasette-geojson-map
Start by loading a GIS file.
For example, you might use geojson-to-sqlite or shapefile-to-sqlite to load neighborhood boundaries into a SQLite database.
wget -O neighborhoods.geojson https://opendata.arcgis.com/datasets/3525b0ee6e6b427f9aab5d0a1d0a1a28_0.geojson
geojson-to-sqlite boston.db neighborhoods neighborhoods.geojson
(The command above uses Spatialite, but that's not required.)
Start up datasette and navigate to the neighborhoods table.
datasette serve boston.db

# in another terminal tab
open http://localhost:8001/boston/neighborhoods
You should see a map centered on Boston with each neighborhood outlined. Clicking a boundary will bring up a popup with details on that feature.
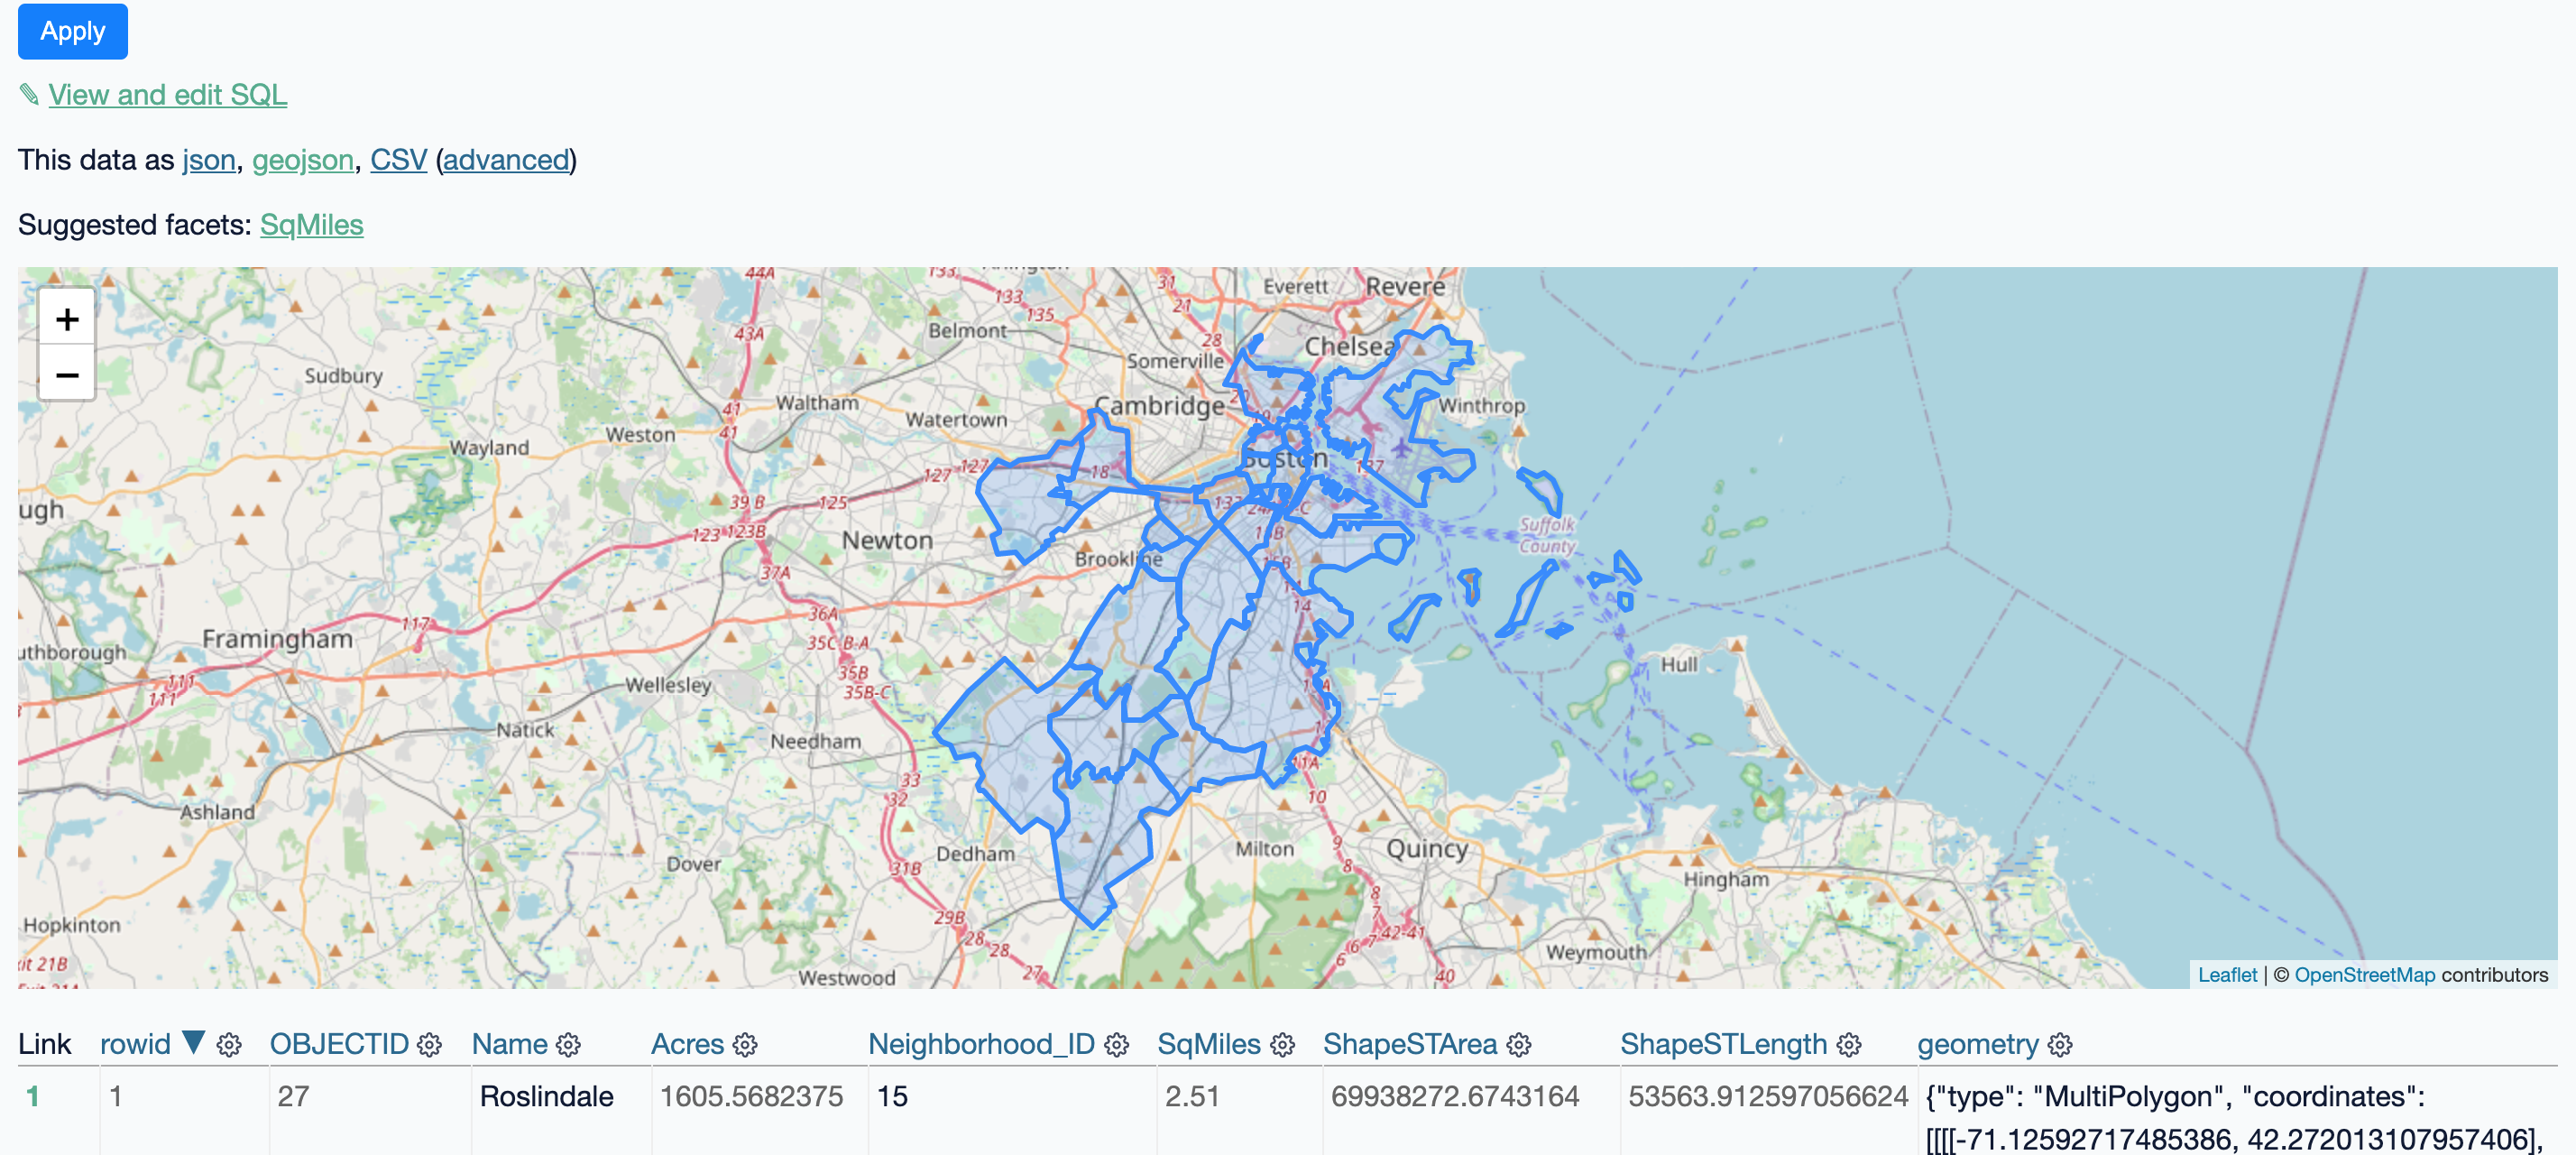
This plugin relies on (and will install) datasette-geojson. Any query that includes a geometry column will produce a map of the results. This also includes single row views.
Run the included demo project to see it live.
This project uses the same map configuration as datasette-cluster-map. Here's how you would use Stamen's terrain tiles:
plugins:
  datasette-geojson-map:
    tile_layer: https://stamen-tiles-{s}.a.ssl.fastly.net/terrain/{z}/{x}/{y}.{ext}
    tile_layer_options:
      attribution: >-
        Map tiles by Stamen Design,
        under CC BY 3.0.
        Data by OpenStreetMap,
        under ODbL.
      subdomains: abcd
      minZoom: 1
      maxZoom: 16
      ext: jpg
Options:
tile_layer: Use a URL template that can be passed to a Leaflet Tilelayertile_layer_options: All options will be passed to the tile layer. See Leaflet documentation for more on possible values here.
Map features can be styled using the simplestyle-spec. This requires setting specific fields on returned rows. Here's an example:
SELECT Name, geometry, "#ff0000" as fill, "#0000ff" as stroke, 0.2 as stroke-width, from neighborhoodsThat will render a neighborhood map where each polygon is filled in red, outlined in blue and lines are 0.2 pixels wide.
A more useful approach would use the CASE statement to color features based on data:
SELECT
  Name,
  geometry,
  CASE
    Name
    WHEN "Roslindale" THEN "#ff0000"
    WHEN "Dorchester" THEN "#0000ff"
    ELSE "#dddddd"
  END fill
FROM
  neighborhoods
This will fill Roslindale in red, Dorchester in blue and all other neighborhoods in gray.
To set up this plugin locally, first checkout the code. Then create a new virtual environment:
cd datasette-geojson-map
python3 -mvenv venv
source venv/bin/activate
Or if you are using pipenv:
pipenv shell
Now install the dependencies and test dependencies:
pip install -e '.[test]'
To run the tests:
pytest