

![]()
![]()
Draw polygons on maps in Datasette
Project background: Drawing shapes on a map to query a SpatiaLite database.
Install this plugin in the same environment as Datasette.
$ datasette install datasette-leaflet-freedraw
If a table has a SpatiaLite geometry column, the plugin will add a map interface to the table page allowing users to draw a shape on the map to find rows with a geometry that intersects that shape.
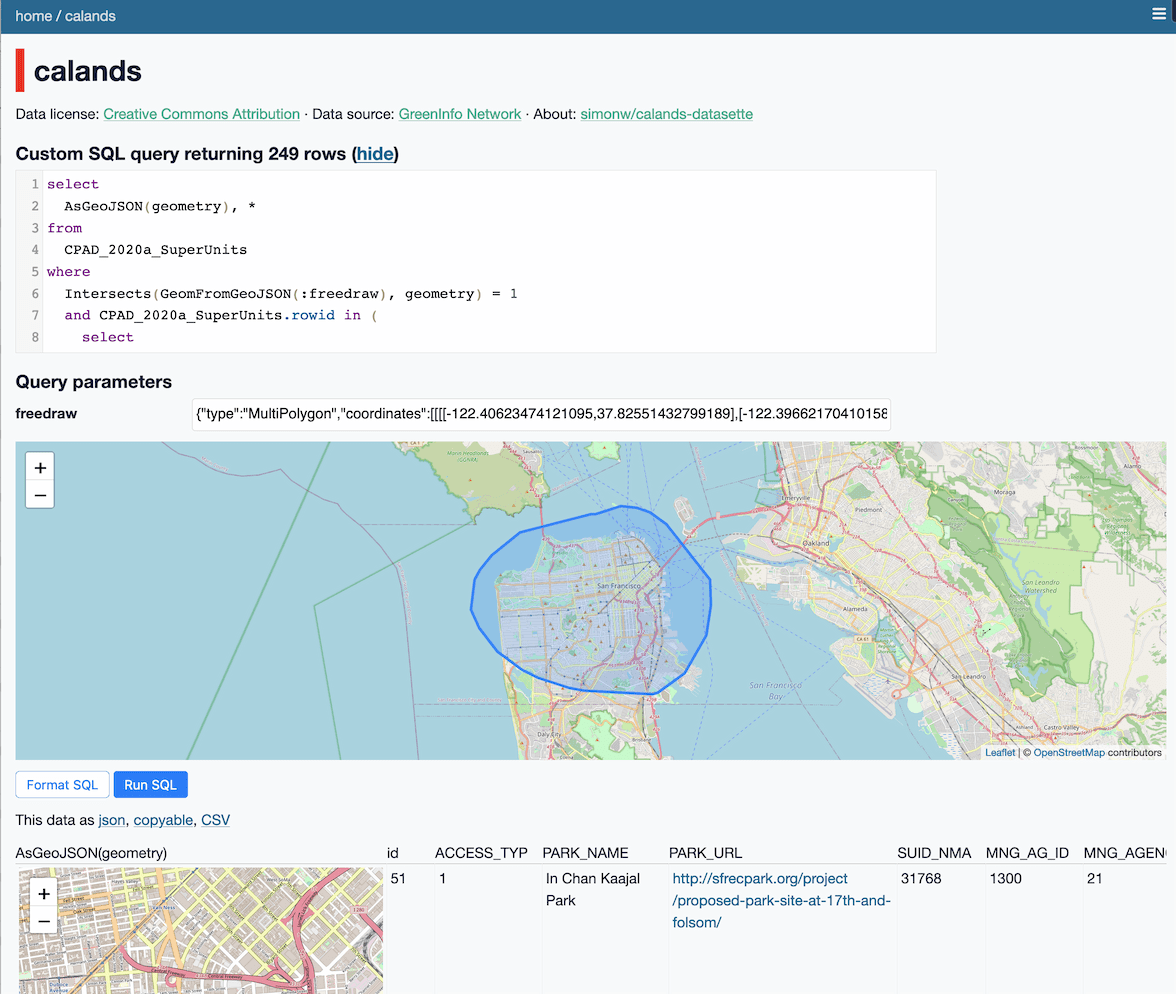
The plugin can also work with arbitrary SQL queries. There it looks for input fields with a name of freedraw or that ends in _freedraw and replaces them with a map interface.
The map interface uses the FreeDraw Leaflet plugin.
You can try out this plugin to run searches against the GreenInfo Network California Protected Areas Database. Here's an example query showing mini parks in San Francisco:
select
  AsGeoJSON(geometry), *
from
  CPAD_2020a_SuperUnits
where
  PARK_NAME like '%mini%' and
  Intersects(GeomFromGeoJSON(:freedraw), geometry) = 1
  and CPAD_2020a_SuperUnits.rowid in (
    select
      rowid
    from
      SpatialIndex
    where
      f_table_name = 'CPAD_2020a_SuperUnits'
      and search_frame = GeomFromGeoJSON(:freedraw)
  )
To set up this plugin locally, first checkout the code. Then create a new virtual environment:
cd datasette-leaflet-freedraw
python3 -mvenv venv
source venv/bin/activate
Or if you are using pipenv:
pipenv shell
Now install the dependencies and tests:
pip install -e '.[test]'
To run the tests:
pytest