Exploring a database with Datasette
This tutorial will teach you how to use Datasette to explore a new database.
Datasette offers flexible tools for exploring data tables. It's always worth spending time familiarizing yourself with data in its raw, tabula form before thinking about ways to apply more sophisticated analysis or visualization.
The congress-legislators data
We'll be using an example database of Members of the United States Congress, 1789 to present. I built this example using data from the unitedstates/congress-legislators project on GitHub, maintained by Joshua Tauberer, Eric Mill and over 100 other contributors.
Access the example in Datasette here: https://datasette.io/legislators
Understanding tables
The key to understanding relational databases such as SQLite (which we are using here), MySQL, PostgreSQL, Oracle and so on is to learn to think in tables.
Database tables are like spreadsheets - they have columns and rows, and each row provides a value for every column. Unlike spreadsheets you can't merge cells together or apply formatting - a database table is a straight-forward two-dimensional grid. It's just the data.
Each column in a table has a type. In SQLite these types can be one of text, integer, real (for floating point values) and blob (for binary data). The type of the column matters because it affects what happens when you sort the table by that column, or which mathematical operations you can use against those values.
Browsing tables
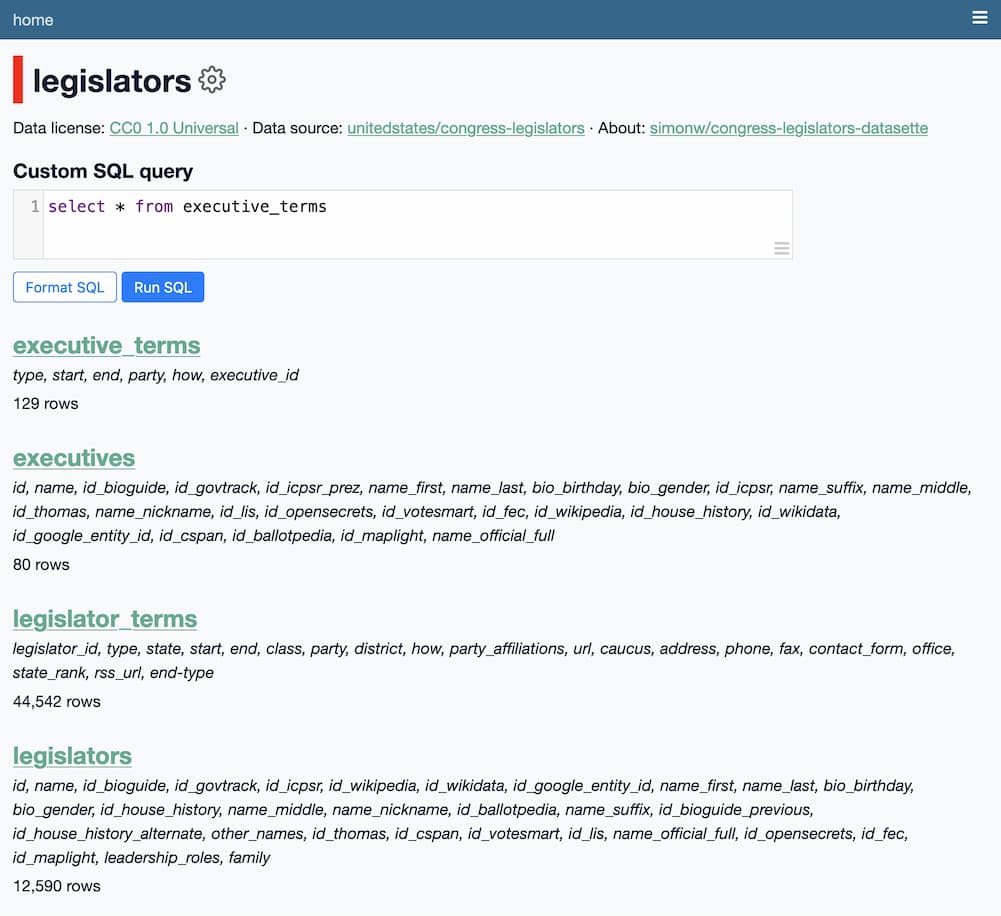
The tables in our example database are:
- legislators - over 12,000 rows - individuals who have served as senators or representatives
- legislator_terms - over 45,000 rows - terms served by legislators, back to 1789
- executives - 80 rows - individuals who have served as President or Vice President
- executive_terms - over 130 rows - terms served by executives
- offices - over 1,300 rows - district officers maintained by current legislators
- social_media - over 500 rows - social media accounts for current legislators
Follow these links now and explore the tables to get a feel for the way the data is organized in this database.
Tables can relate to each other
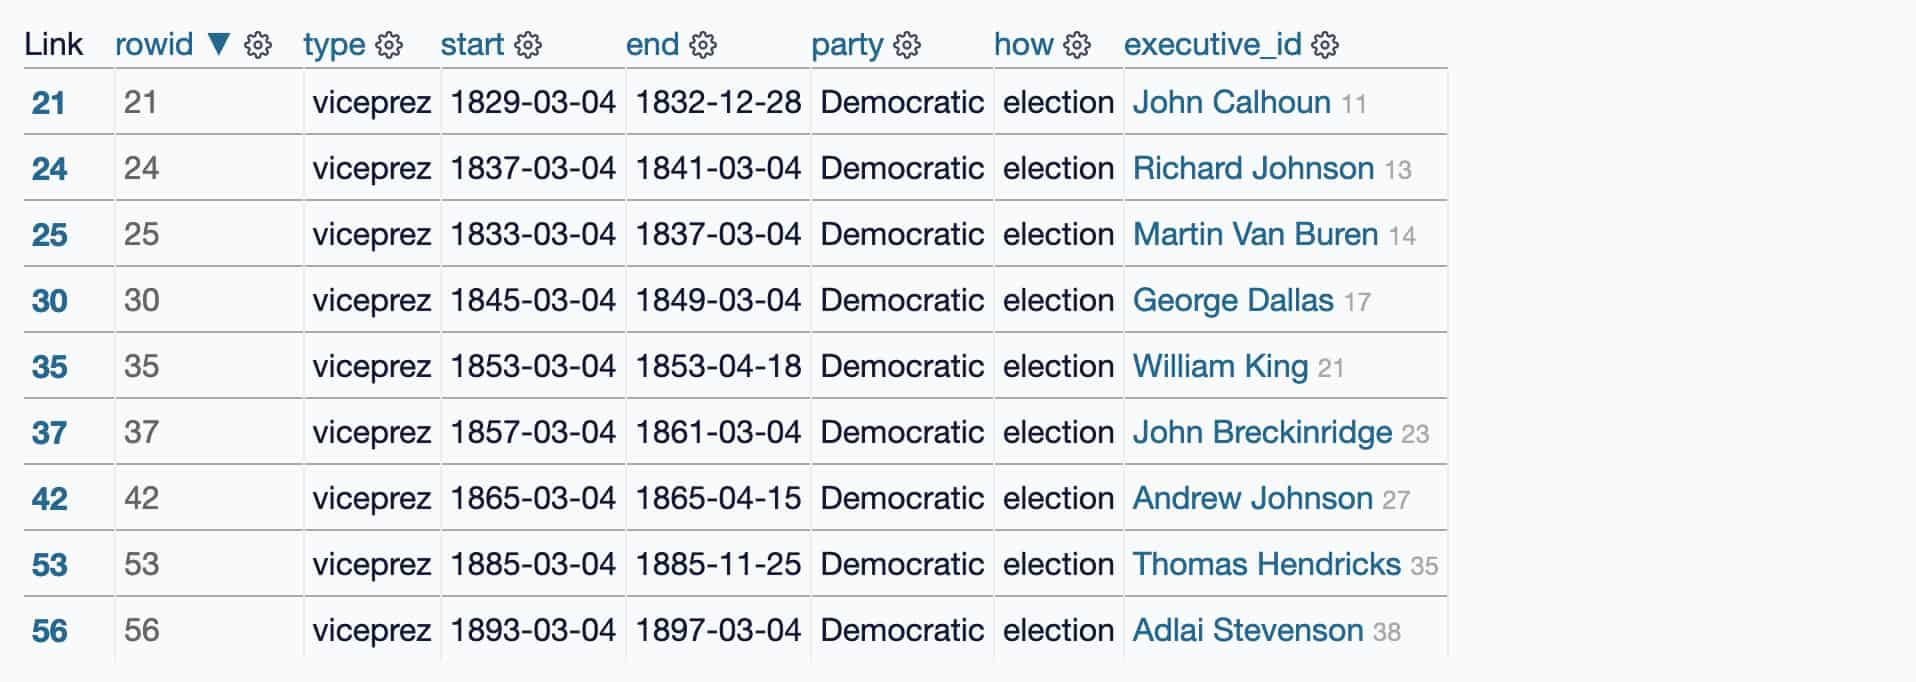
Sometimes you'll see a row in a table that links to another table, for example the legislator_id column in the legislator_terms table:
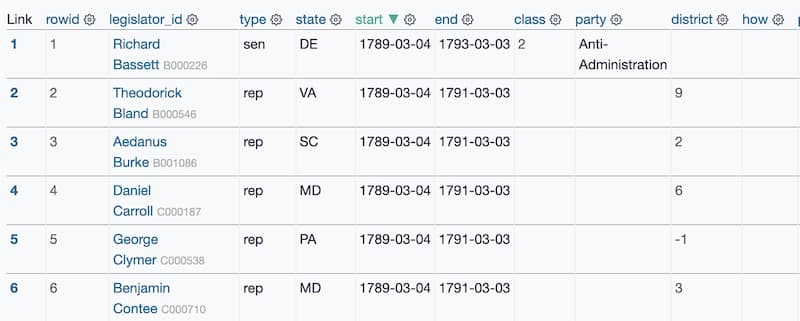
Clicking one of the linked names in that column will take you to a page for that individual legislator row that looks like this:
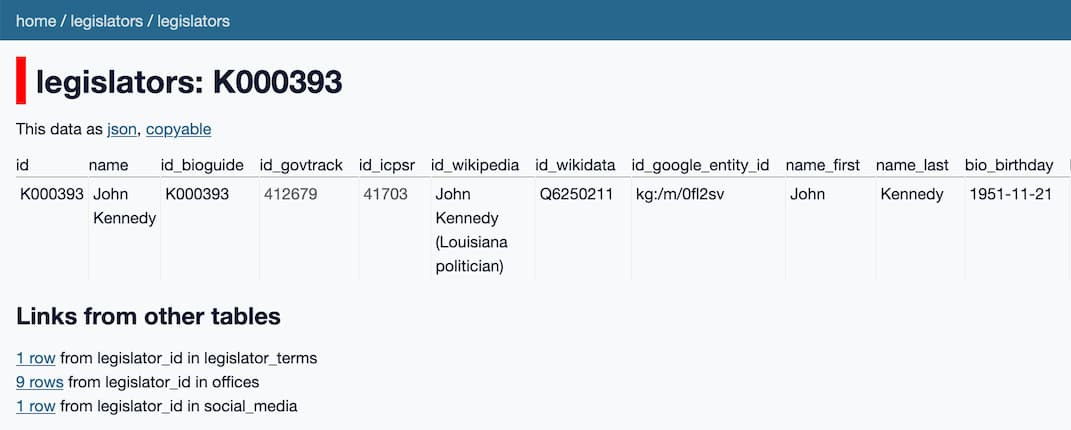
The "Links from other tables" section shows how many rows in other tables refer back to this legislator.
In a database these are called "foreign keys" - they work by storing the ID of a row from another table in a dedicated foreign key column.
Foreign keys are key to understanding why relational databases are so much more powerful than separate, stand-alone data files stored in something like CSV.
Using facets
Facets are one of the most powerful Datasette features. They can help you take a table with thousands of rows and start quickly identifying interesting trends and patterns within that data.
I'll show some examples using the executive_terms table.
Facets can be applied in two ways: you can select an option from the "suggested facets" list, or you can select the "Facet by this" option from the cog menu next to each column.
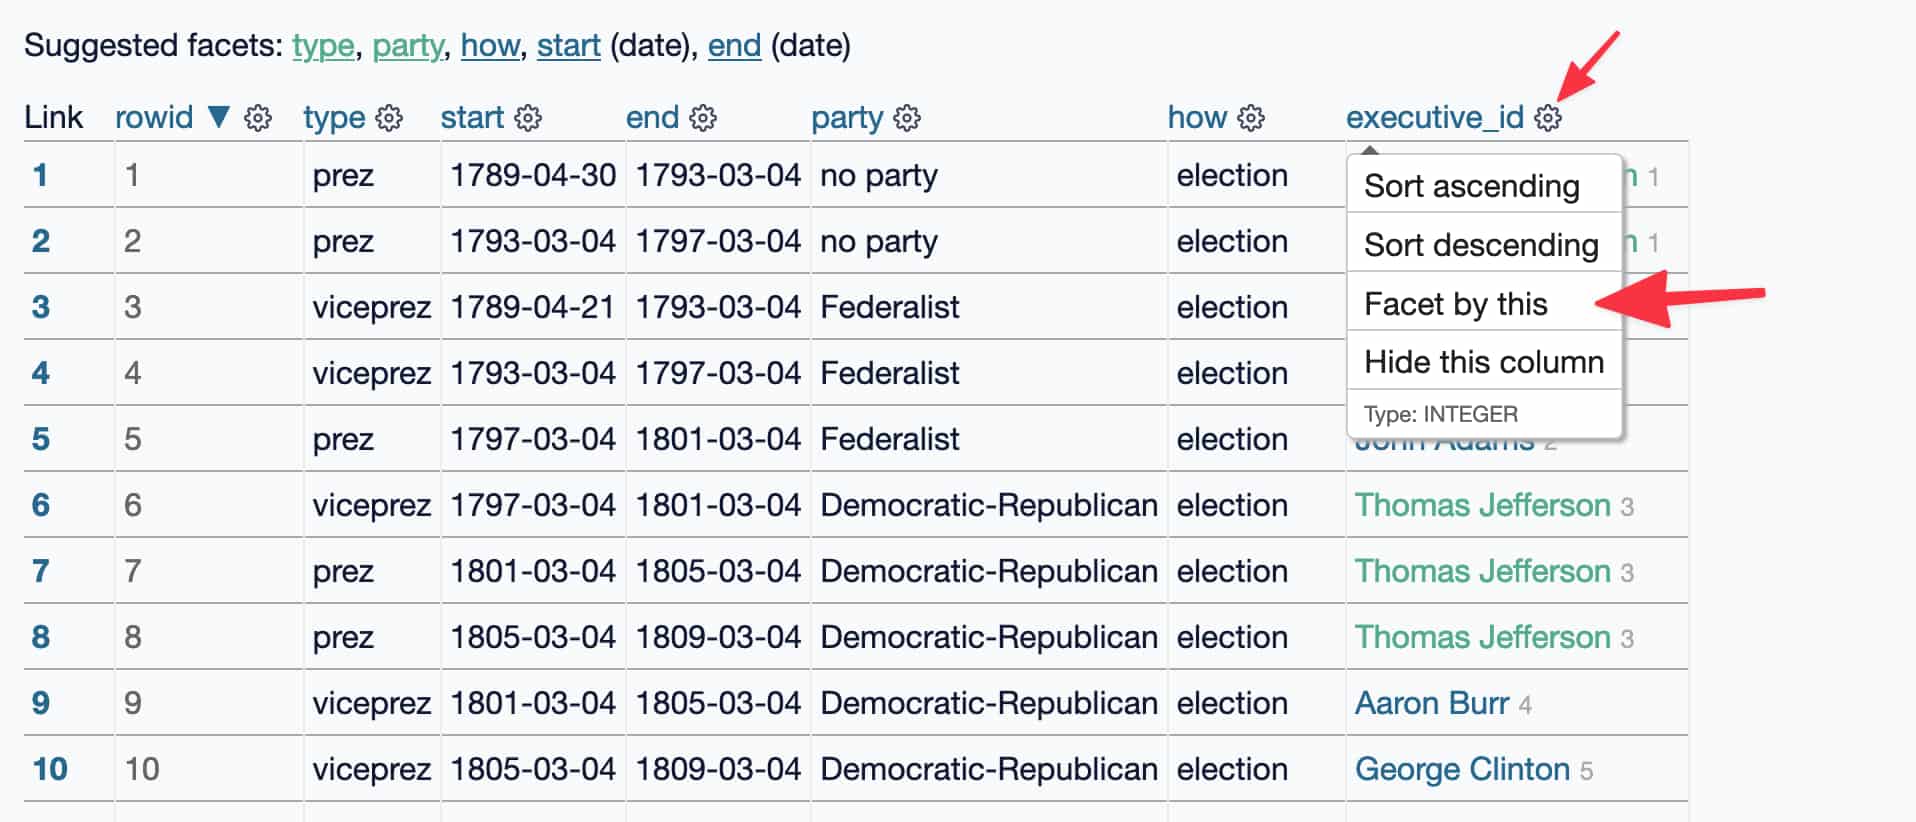
Once selected, the facet interface is shown above the table, like in this example:
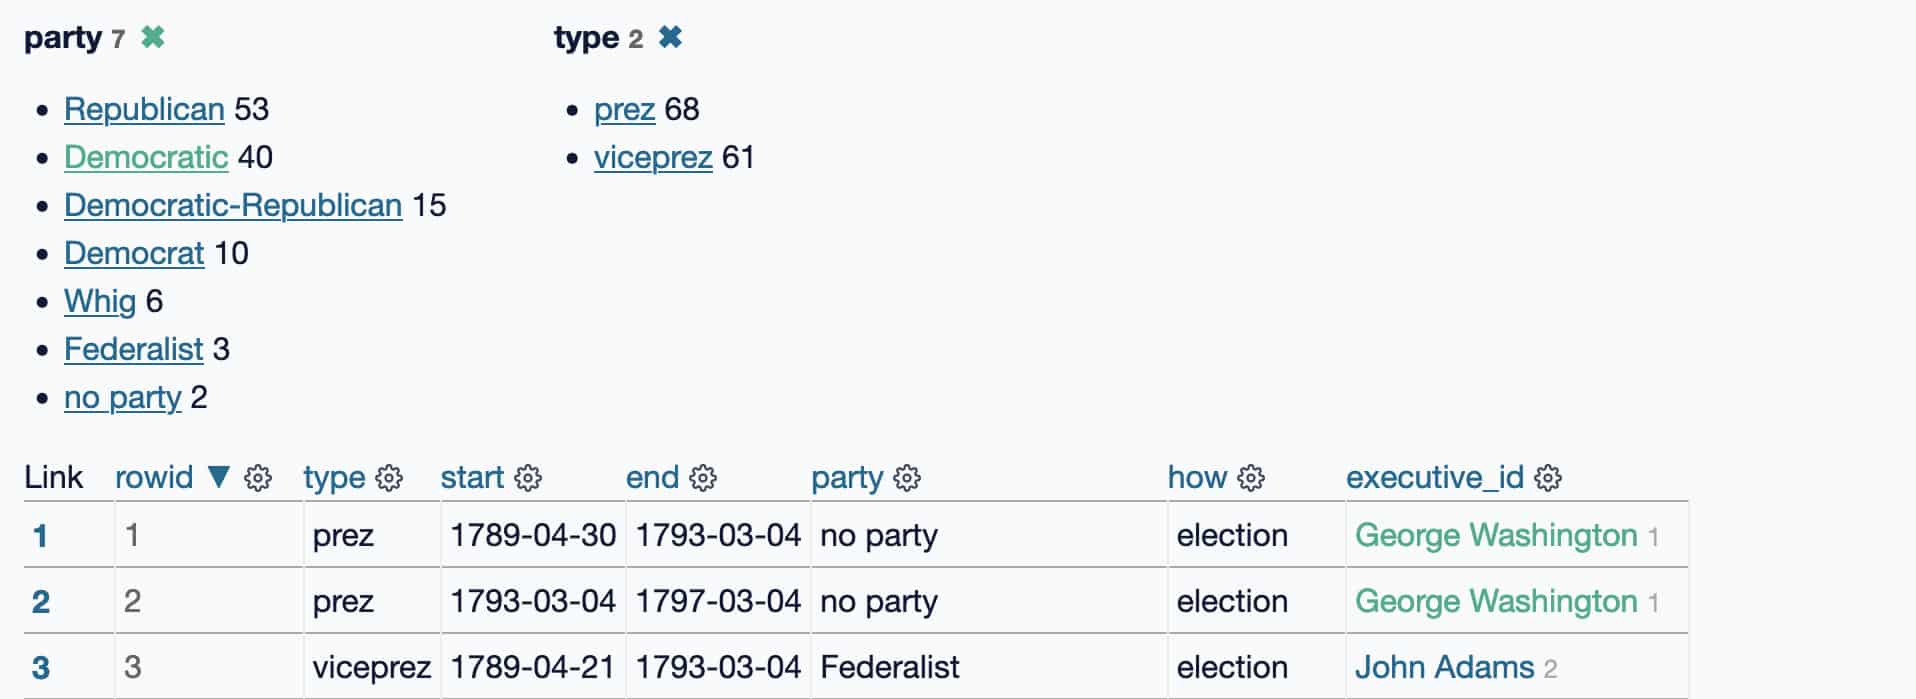
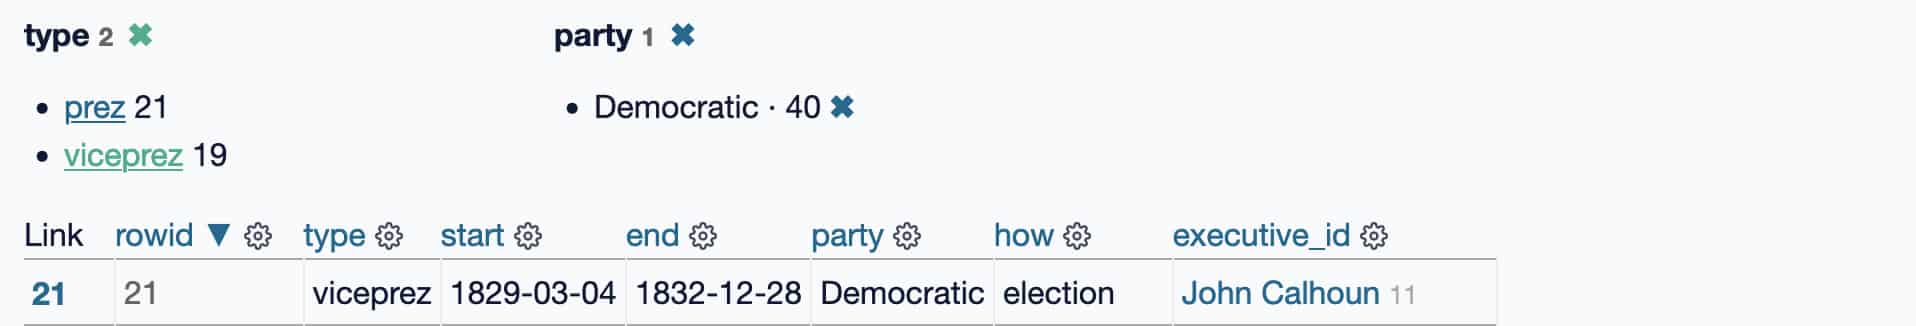
Each facet shows a list of the most common values for that column, with a total count number for each of those values.
These numbers will update as you further filter the data: if you select "Democratic" you will see just the rows matching that party, and the "type" facet will update to show you that there have been 21 presidentals terms and 19 vice presidental terms for that party.
Exercises
- Apply the
type,stateandpartyfacets to the legislator_terms table - Use them to filter just to Republican Senators from North Carolina (NC)
- Figure out which state has had the highest number of senatorial terms held by a member of the Republican party. (solution if you get stuck)
Using filters
When you select a facet, you're applying a filter to the data. These are reflected in the boxes at the top of the page:
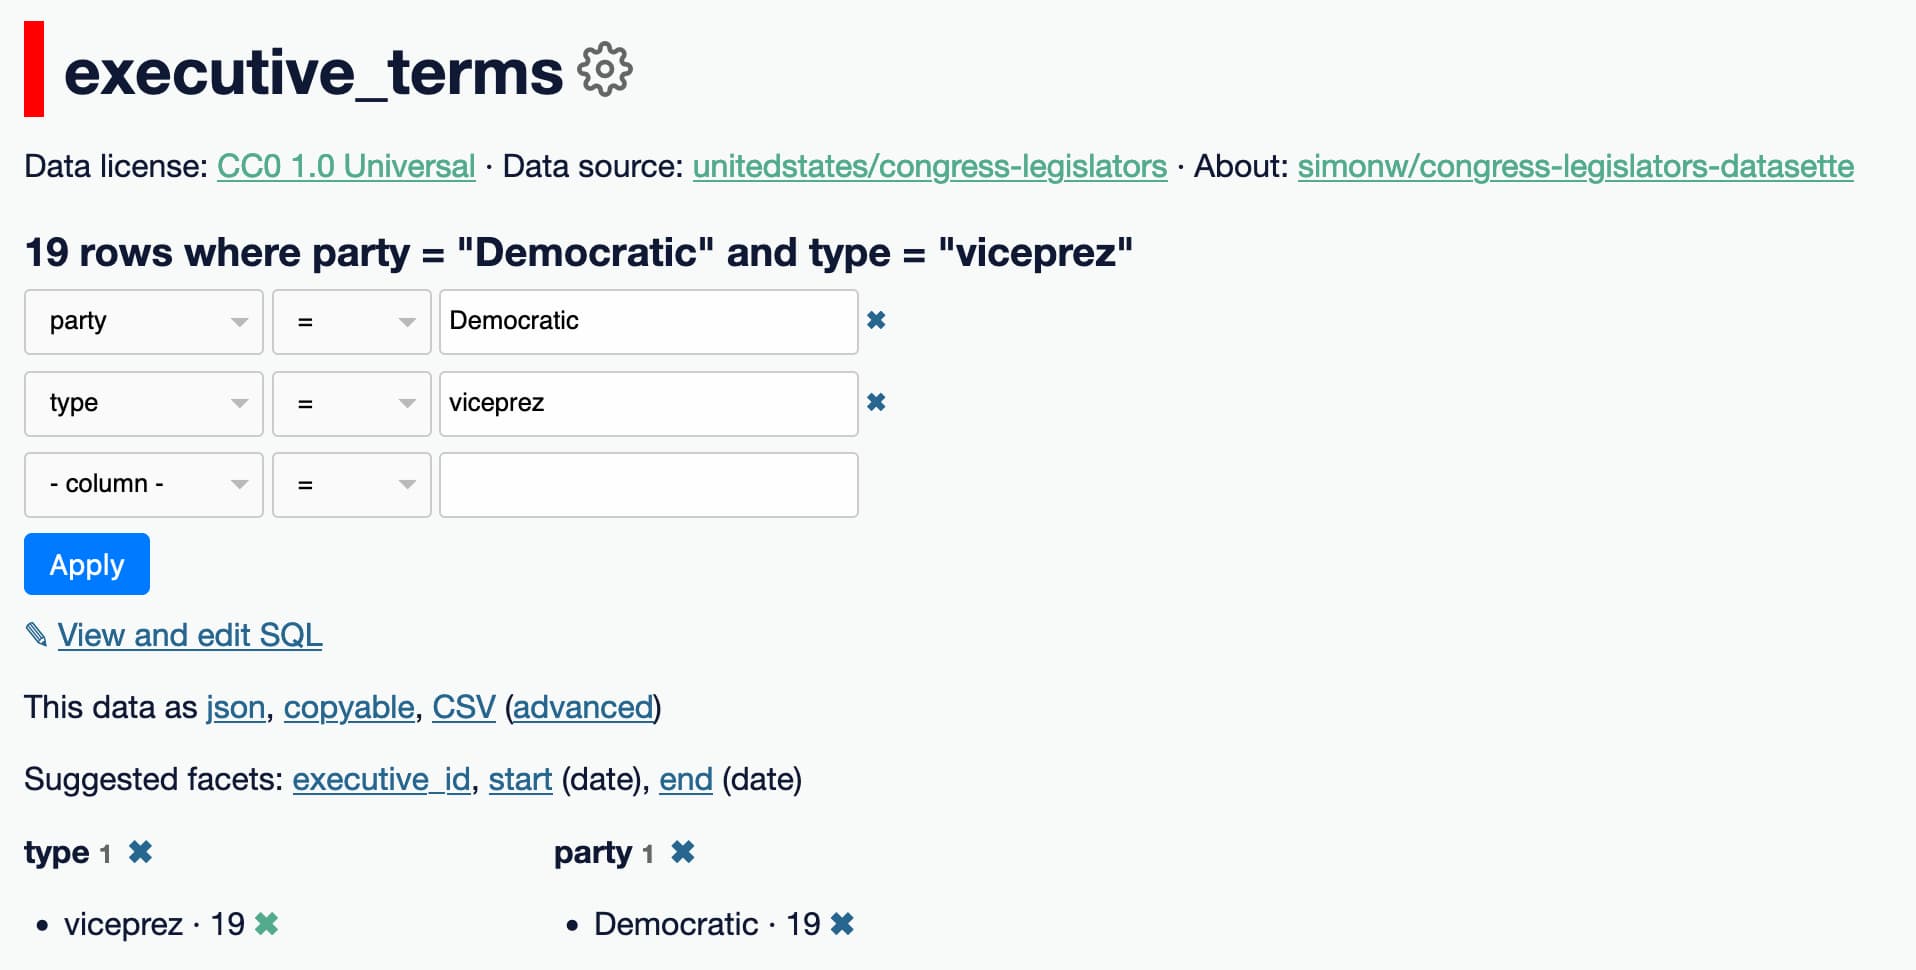
You don't have to use faceting for these - you can edit them directly.
To see Democratic Vice Presidents just for the 1800s, we can add a filter for rows where the 'start' column begins with '18':
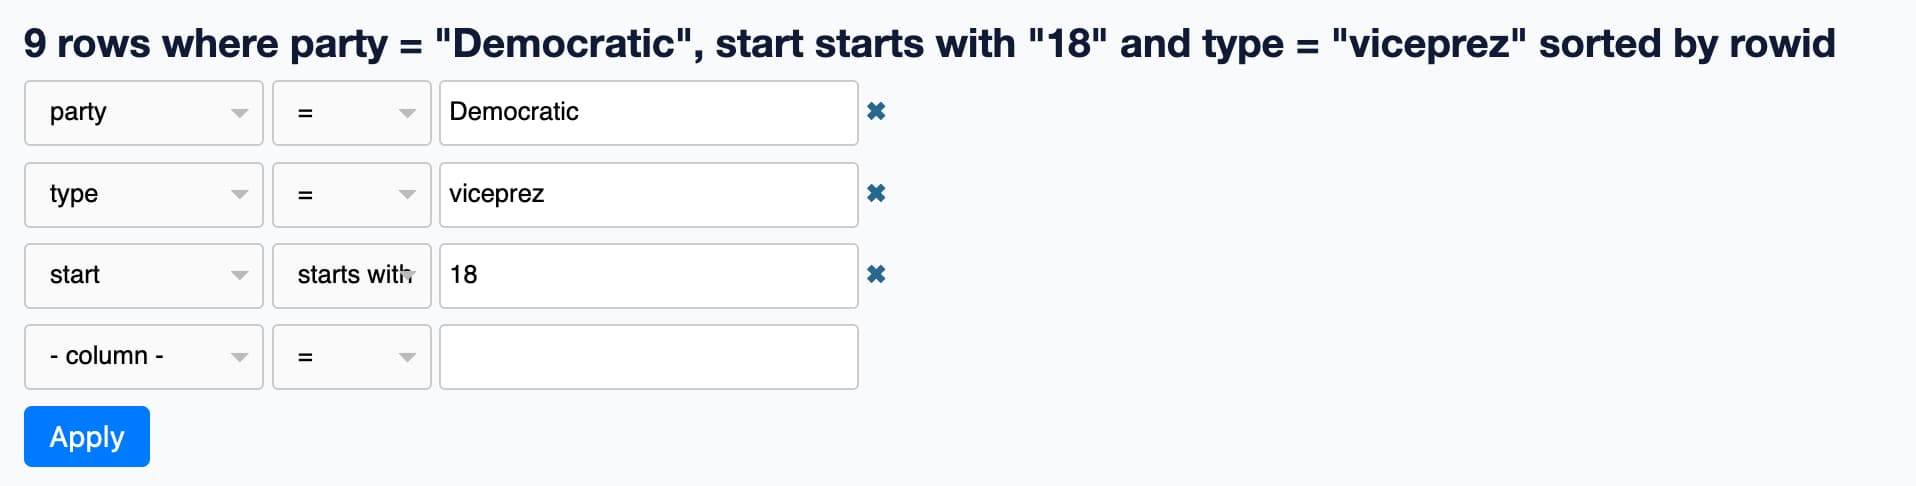
Here's the result of that query.
Exercises
Using the legislator_terms table, find:
- Every senatorial term served in Delaware (DE)
- ... that started in a year starting with 18
- ... and then facet by party to see which parties had the most senatorial terms
Sharing links
Every page within Datasette is designed to be shared. Copy and paste the page URL to share it with someone else.
This includes applied filters and facets - so if you find an interesting way to explore the data you can share that directly by sharing the URL.
Some examples:
- Every senatorial term in the state of Texas
- Every executive term held by a member of the Democratic-Republican party
Exercise: share some links!
Use the above exercises to find something interesting in the data. Copy and paste that URL to your notes, or share it with a friend, or post about it on Twitter.
Exporting data
If you can see it in Datasette, you can export the raw data. This is a fundamental principle of the project.
Look for the CSV and .json links on any page to export the data in those formats.
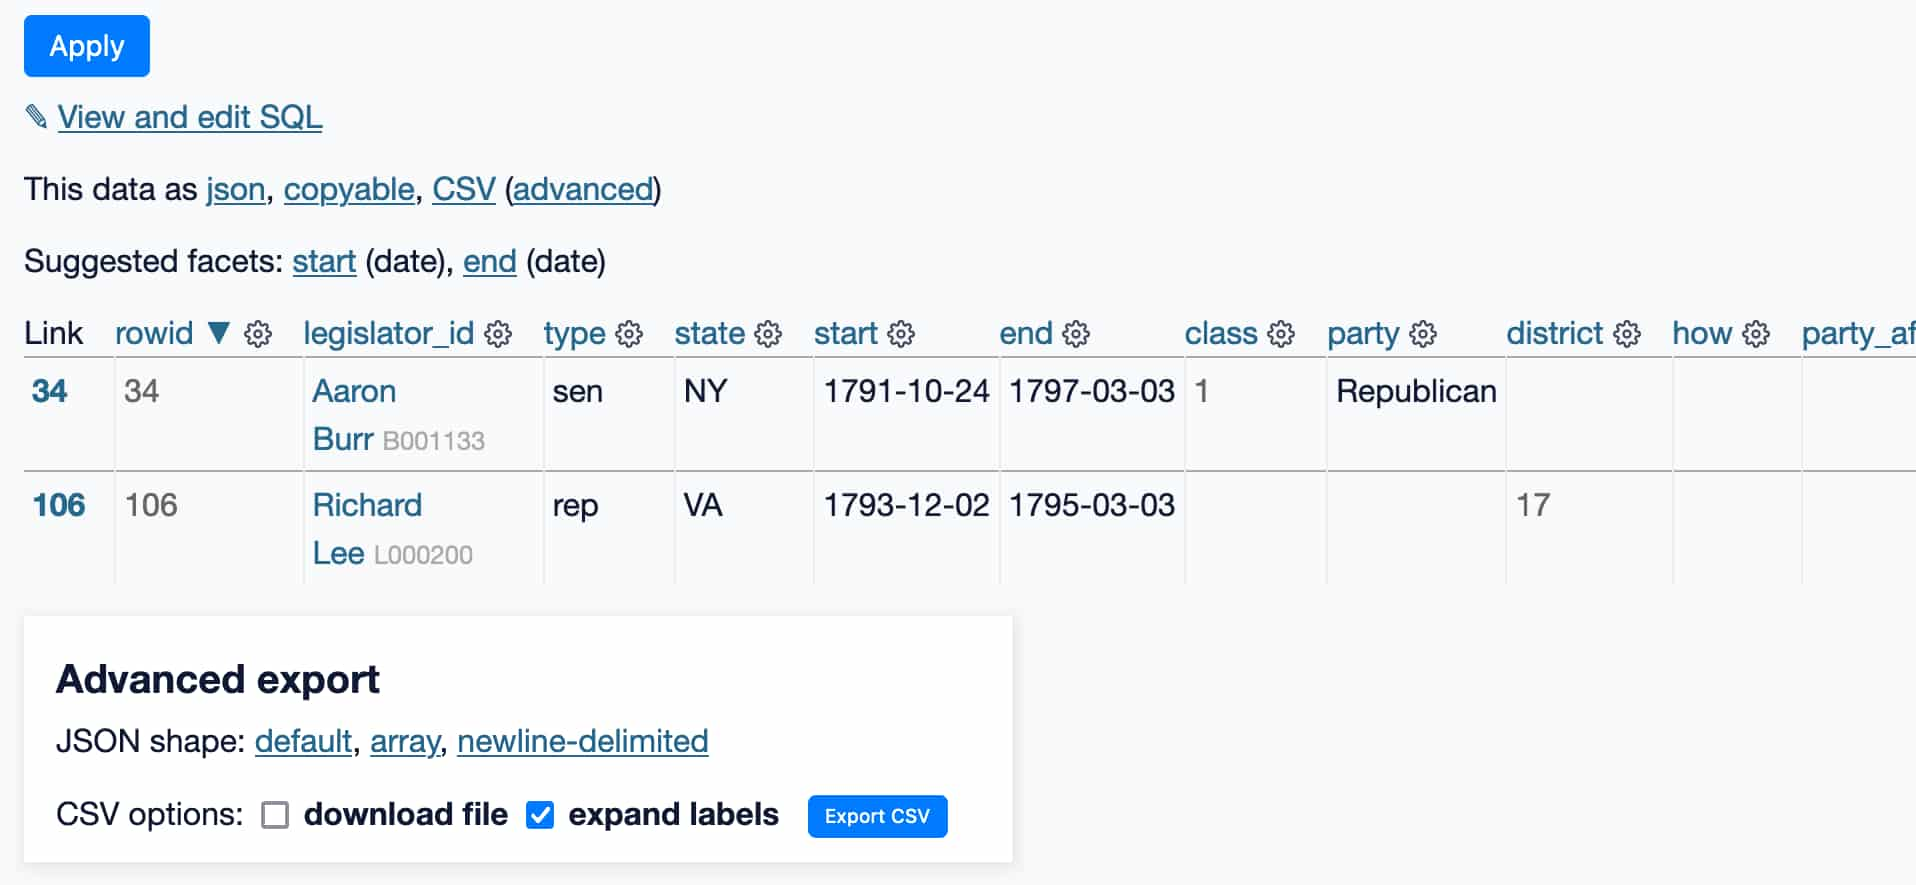
The "Advanced export" box provides additional options. Use "download file" to download the CSV file to your computer.
The "expand labels" option will add an extra column with the label associated with any foreign key columns - in this example, it will add legislator_id_label to accompany the ID in legislator_id.
Additional formats can be enabled using plugins. The example instance is running the datasette-copyable plugin, which provides a `"copyable" link which can be used to export the data in different formats using copy-and-paste!
Datasette can also be configured to allow users to download the entire database as a single file. You can find that legislators.db download option at the bottom of https://datasette.io/legislators - the entire database is around 5.5MB.
Exercises
- Download a CSV file of Democratic Vice Presidents in the 1800s, using the "download file" checkbox in the "Advanced export" box.
- Use the "copyable" option to copy and paste that data directly into Google Sheets, Excel or Numbers.
Data visualization via plugins
You may have noticed this already on the offices table, which shows an interactive map of all of the office locations:
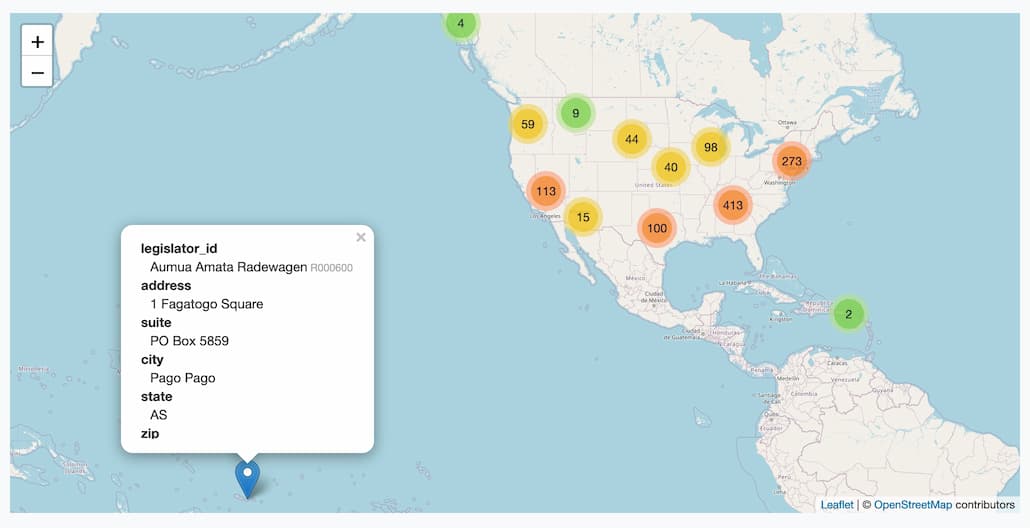
You can click on clusters of markers to zoom in, and click on individual markers to see the details of the row.
It's fun to use these maps to spot obvious outliers - in this case, the office of representative Aumua Amata Radewagen in American Samoa instantly stands out.
This is another example of a Datasette plugin - in this case datasette-cluster-map. Plugins can add additional features to Datasette, such as visualizations or alternative export methods (see "copyable" described above).
For a larger example of a map visualization, take a look at this map of 33,000+ global power plants visualized using datasette-cluster-map.
Next steps
Now that you know how to explore tables using Datasette, the next covers how to use Datasette to learn SQL.